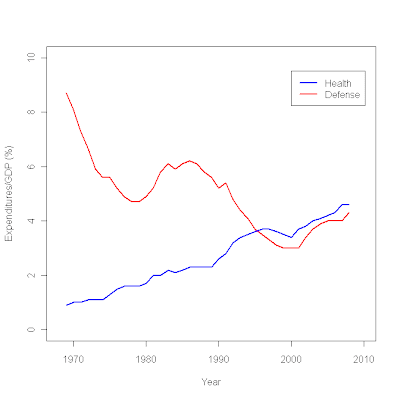
It's pretty easy!
plot (c(1968,2010),c(0,10),type="n", # sets the x and y axes scales
xlab="Year",ylab="Expenditures/GDP (%)") # adds titles to the axes
lines(year,defense,col="red",lwd=2.5) # adds a line for defense expenditures
lines(year,health,col="blue",lwd=2.5) # adds a line for health expenditures
legend(2000,9.5, # places a legend at the appropriate place c("Health","Defense"), # puts text in the legend
lty=c(1,1), # gives the legend appropriate symbols (lines)
lwd=c(2.5,2.5),col=c("blue","red")) # gives the legend lines the correct color and width
Subscribe to:
Post Comments (Atom)
Post a Comment 4 comments:
Thank you.
Helped me a lot. Just one question remains:
How do you create custom symbols for lty=c() in case you want to use marks like *,+,o that are measured points in the graphic?
September 23, 2016 at 6:06 AM
thank you !!!
May 14, 2017 at 11:21 PM
I am very happy with your support.
May 14, 2017 at 11:48 PM
Hi there! I'm struggling a bit with trying to add the legend for my plot...wonder if you could help me out? I have three lines to add the labels for and they're differentiated by pattern instead of colour. Would appreciate any help!
Here's the code I have so far:
plot(Abundancel~Size, data=SizeSpectrumCG, xlim=c(7, 50), pch=as.numeric(Depth), bg="transparent",bty="l", main="Size Spectrum of Fish at Coral Garden", xlab = 'Total fish length (cm)', ylab = 'Log abundance')
lines(CG1m, predict(CG1m.lm, data.frame(Size=CG1m)), lwd=2,col="blue")
lines(CG5m, predict(CG5m.lm, data.frame(Size=CG5m)), lwd=2,lty="dashed",col="blue")
lines(CG10m, predict(CG10m.lm, data.frame(Size=CG10m)), lwd=2,lty="dotted",col="blue")
legend(3.0,50,c("1m","5m","10m"))
lty=c(1,1,1),"solid","dashed","dotted"
lwd=c(2,2,2),col=c("blue","blue","blue")
February 4, 2018 at 7:55 PM