OK, let's say you want to create a plot and you need an easy way to specify where along the scale your tick marks and labels land, as opposed to having R just decide itself. An easy way to do that is to create a vector and assign the axis characteristics tio the vector (or vice versa, depending on how you look at it.)
First, let's create some data to plot:
a <- c(12,4,56,4,65,7,19,25,40,12)
b <- c(42,16,36,4,25,47,29,75,10,22)
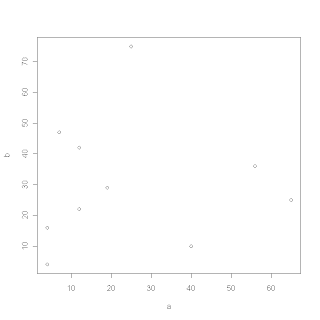
Now we can plot a against b and we get:
plot (a, b)

OK, that's an ugly plot but it serves our purpose as an example. Notice that both axes have tick marks every 10 points. Suppose we wanted to specify that they were closer (or further apart.) Let's say we wanted them to be every five points away. (We probably don't want that, but we'll deal with that in a minute.)
First, let's create a vector that covers the range of both axes, and is in intervals of five. We'll name that vector, 'd':
d <- seq(0,70,by=5)
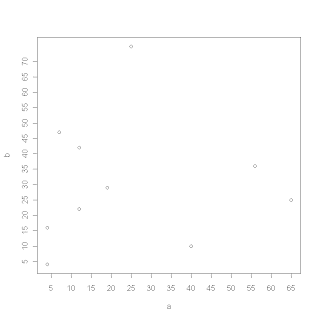
Now, let's re-create our plot, but use the vector we created as the 'rule' by which the axes ticks and labels are placed:
plot (a, b, xaxt = 'n', yaxt = 'n')
axis (1, at = d)
axis (2, a t= d)

e <- seq(0, 70, by = 20)
plot (a, b, xaxt = 'n', yaxt = 'n')
axis(1, at = e)
axis(2, at = e)
Voila!
Next we'll look at making custom axis labels, i.e. 'small', 'medium', 'large' with vectors.
