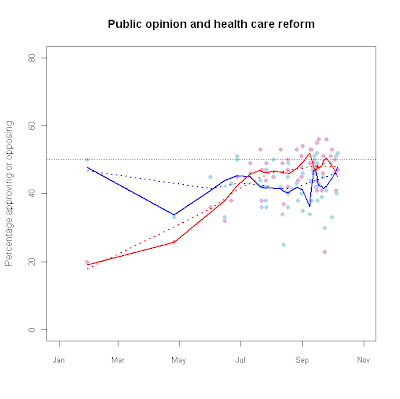
hc_app<-read.table("n:/misc/healthcareapproval.txt", header = T, sep = "\t")
attach(hc_app) hc_fit.o1<-lowess(Oppose~as.Date(Dates),f=0.25)
hc_fit.f1<-lowess(Favor~as.Date(Dates),f=0.25)
hc_fit.o2<-lowess(Oppose~as.Date(Dates),f=0.75)
hc_fit.f2<-lowess(Favor~as.Date(Dates),f=0.75)
plot(as.Date(Dates),Oppose,
main="Public opinion and health care reform",
ylim=c(0,80),pch=16,
xlim=c(as.Date("2009-01-01"),as.Date("2009-11-01")),
cex.axis=.85, col="#E6ADD8",
xlab="",ylab="Percentage approving or opposing") points(as.Date(Dates),
Favor,pch=16,col="#ADD8E6")
lines(hc_fit.f1,col="blue",lwd=2)
lines(hc_fit.o1,col="red",lwd=2)
lines(hc_fit.f2,col="blue",lwd=2,lty=3)
lines(hc_fit.o2,col="red",lwd=2,lty=3)
abline(h=50,lwd=.5,lty=3,col="#555555")
Subscribe to:
Comments (Atom)